AAI: Average Amino Acid Identity
The Average Amino Acid Identity (AAI) is a very useful metric of similarity between two genomes that can effectively be used for (among others) taxonomic classification1.
Originally, this metric was proposed using BLAST as the search engine2, and that’s the default for the implementation I use in the Enveomics Collection3. This works great for a few comparisons, but the long running time becomes a problem when building an all-vs-all distance matrix, because the number of comparisons grows quadratically with the number of genomes. On average, a single-threaded AAI estimation with BLAST takes about 6 to 7 minutes, which means over 45 CPU days for a relatively small collection of 100 genomes. I have implemented a quick estimator of AAI using only conserved genes for distant pairs (hAAI, available as part of MiGA4), and it solves the issue effectively for about 70-95% of the comparisons (depending on the relatedness of the genomes), but the problem remains for a constant fraction of the matrix that can still add to CPU times in the order of years for collections with about 10 thousand genomes.
For these large collections, I’m replacing the search/alignment engine of AAI for Diamond, and here are some results.
Time reduction
Is Diamond THAT much faster to worth the switch? Yes! Diamond-based AAI takes, on average, between 6 and 16 seconds (depending on the relatedness and completeness of the genomes), which is about 30 to 50 times faster than BLAST. In fact, the CompareM implementation seems to be even faster, averaging (in a smaller test set) about 3 seconds. However, CompareM doesn’t have all the whistles that I need in MiGA (e.g., SQLite3 support to store intermediate and final results), so I’m sticking with the Enveomics Collection implementation.
AAI correlation
I ran a large-scale experiment using all the genomes available from type material (9,076 genomes, available at MiGA Online). In this set, most pairs can be resolved using the hAAI (about 96%), so I’m evaluating what happens with the remaining 3.4 million pairs (still a very large number!).
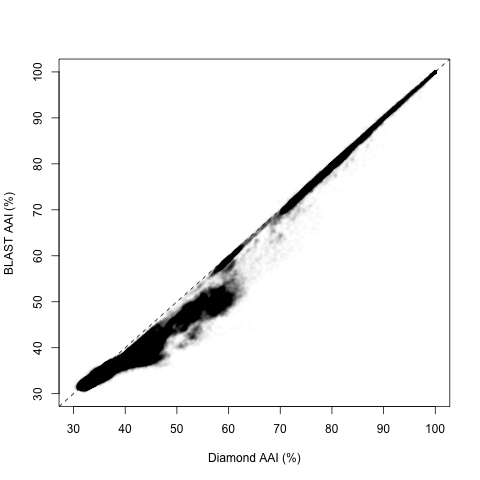
Overall, the two estimates have a high correlation (Pearson’s R = 0.988):

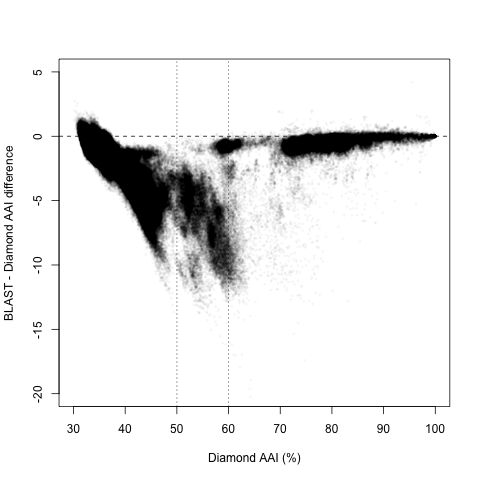
However, upon closer inspection, it appears there are two regions with different behaviors, splitting around 60% and 50% Diamond AAI:

Diamond AAI > 60%
For the closest pairs, it looks like the correlation is almost perfect, with a Pearson’s R = 0.992 (n = 83 thousand, or 2.4%). Moreover, the absolute difference was usually less than 1 percentual point, with an average difference of 0.88% on average (Inter-Quartile Range -IQR-: 0.12-0.84%). And the correlation was even better in the closest relatives (where single-digit deviations could matter most). For those with Diamond AAI > 90%, Pearson’s R = 0.999, and the absolute difference was 0.068% on average (IQR: 0-0.074%).
Diamond AAI < 50%
Now, what happens with the most distant pairs? The results are still good. Not great, but pretty good. The Pearson’s R = 0.942 (n = 3.3 million, or 96.4%), which means there is a high linear correlation, and an absolute difference of 1.2% on average (IQR: 0.58-1.38%). This difference is not that bad: less than 1.5 points in more than 3/4 of pairs. Staying within 2% of the estimate is actually pretty good for such low AAI. However, the line is far from 1:1. A linear correlation indicates that, in this region, BLAST AAI = 10.92 + 0.657 * Diamond AAI. What about intermediate values?
Diamond AAI between 50 and 60%
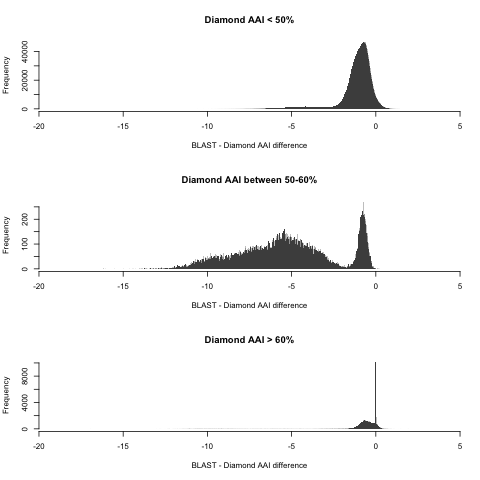
Here’s where things get trickiest, because there is significant overlap from both regimes: some higher values follow the 1:1 line closely, while some lower values continue (with some shift) the non-1:1 linear trend seen in more distant pairs. For this region, Pearson’s R = 0.753, which means a very low predictive power. The absolute difference is a whopping 5.26% on average (IQR: 3.4-7.3%). The overlap between regimes is seen the plot above, but it’s even more clear when we study the distribution of differences between BLAST and Diamond AAI for each region in isolation:

Remember that I’m only using here the pairs for which hAAI failed, meaning that ALL the pairs here matter (even distant pairs). Perhaps this issue can be corrected upon closer inspection of the pairs in this set, but in the meantime this means that I need to implement reference taxonomic distributions in MiGA using both BLAST AAI and Diamond AAI separately. Speaking of which…
Diamond AAI for taxonomy
We have established that the out-of-the-box replacement of BLAST for Diamond is not without issues. However, can we still use this non-linearly-correlated estimate to determine taxonomic affiliation? Well… the overall correlation is actually pretty good, despite the region-specific issues. The Pearson’s R = 0.988 for the entire distribution. Moreover, we know this is not an effect of the dynamic ranges but an actual monotonic correlation, because Spearman’s rho = 0.938. Not as impressive, but still pretty high. In fact, the overall estimate is relatively close throughout, with an absolute difference between estimates of 1.22% on average (IQR: 0.57-1.39%).
Conclusions
Diamond shows a great potential as a BLAST replacement in the estimation of AAI, but the distribution of identities needs to be further studied in order to identify appropriate corrections that allow a 1:1. Given Diamond-specific considerations (such as empiric distribution specific for Diamond AAI), we can indeed use the Diamond AAI values in MiGA. Importantly, the accuracy of the taxonomic affiliations using Diamond AAI must be re-evaluated.
References
-
Rodriguez-R LM, Konstantinidis KT. 2014. Bypassing Cultivation To Identify Bacterial Species. Microbe 9:111–118. More details. ↩
-
Konstantinidis KT, Tiedje JM. 2005. Towards a Genome-Based Taxonomy for Prokaryotes. J Bacteriol 187(18):6258-6264. DOI: 10.1128/JB.187.18.6258-6264.2005 ↩
-
Rodriguez-R LM, Konstantinidis KT. 2014. The enveomics collection: a toolbox for specialized analyses of microbial genomes and metagenomes. PeerJ Pre 4:e1900.2016. More details. ↩
-
Rodriguez-R LM, et al. 2018. The Microbial Genomes Atlas (MiGA) webserver: taxonomic and gene diversity analysis of Archaea and Bacteria at the whole genome level. NAR 46(W1):W282-W288. More details ↩